This is a moment we all knew would arrive, and there is no point in pretending anymore. It’s overwhelming, yes, and it’s been easy to say to ourselves, “No no, this is nothing! My results will just appear,” or “Doesn’t SurveyMonkey do my analysis?” Perhaps, “Surely my chair won’t leave me out to dry this way.”
Unfortunately, your chair is nowhere to be found, because they know as we know that this is unpleasant business. Or at least it can be. You’ve likely had enough statistics in your coursework leading up to the dissertation to be dangerous, as they say, and you’ve also chosen, one way or another, to take on a quantitative study. Of course, it might be that you never intended to do a quantitative study but that your chair or another committee member pushed you either by degrees or all at once to abandon your qualitative research dreams and wake up in a reality populated only by numbers.

I do hope that has not been the case for you! Even if it is, though, there is something wonderful and clean about statistical analysis and the mathematical precision of your eventual results, and they will provide a degree of certainty about relationships among clearly-defined variables that qualitative studies cannot even flail at. In short, they’re intensely rigorous.
They’re also subject to messing up, and results are vulnerable to misinterpretation. After all, Benjamin Disreali, or Leonard Courtney, or Mark Twain said, “There are three kinds of lies: Lies, damned lies, and statistics.” Or maybe it was Arthur Wellesley?
Because that statement is self-evidently true (maybe we’ll do a post on fallacious reasoning), it’s a good idea to reach out to a statistician or a dissertation consultant to help with the kinds of decision-making you’ll do in planning for your statistical analysis and then in the conduct of the testing itself. It’s just a good check to have, and a second set of eyes is always useful.

We’ll talk about a number of the most basic issues, though, here in Stats 101. We’ll also develop a framework for continuing your education in the later courses in the series.
Stats Overview
We have talked about or will talk about quantitative studies more generally in another post. There, we’ll engage with the ins and outs of research design, making sure you achieve alignment and are able to actually carry out the study that you’ll need to based on your initial research, and a host of other concerns. In this related but different discipline, we’ll deal with what happens when you must reckon with all the decisions you’ve made.
That is, you have to analyze your data. But how do you know which tests to do? We’ll talk about that in due course. First, there are a number of considerations that will determine your testing. As you know, your job is to test your hypotheses. Each posits a relationship among variables, and your statistical testing will vary as a function of (a) the number and type of variables and (b) the nature of the relationships.
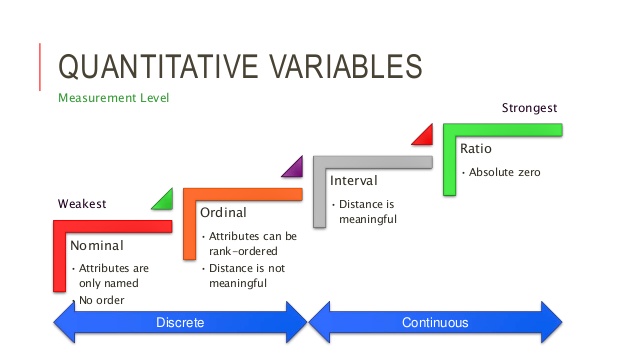
Number and type. This is Stats 101, so we’ll talk mostly about bivariate (two-variable) testing, with a tiny sprinkle of multivariate testing at the end. In terms of variable type, though, we’re dealing with three main options, two of them much more common than the third:
- Nominal – Also called “categorical,” these variables without any inherent order. A good way of thinking about this is that participants are put into categories on the basis of these variables. Examples: Race, gender, ethnicity, experimental group, pass/fail status.
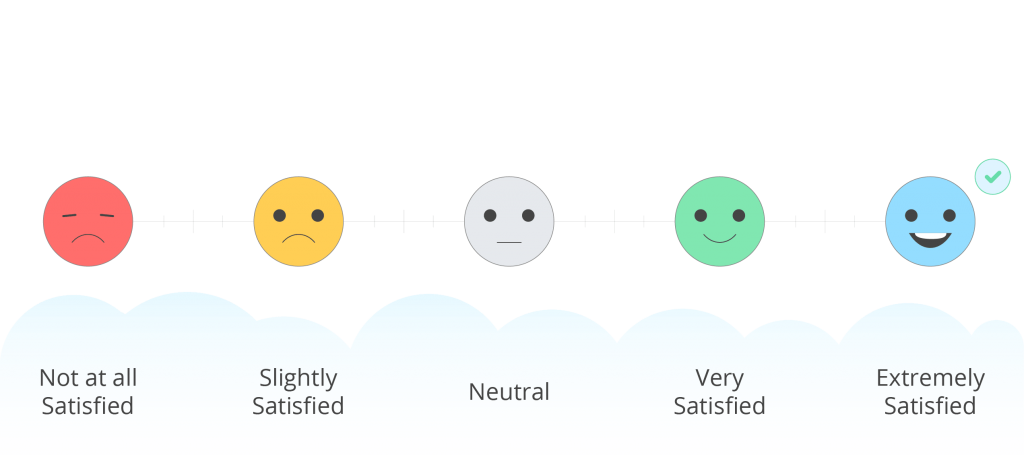
- Ordinal – These variables aren’t cool enough to get another name, and they describe data that have a particular order or sequence without equal distances between them. Examples: Course grade (A, B, C, D, or F), BMI classification, level of satisfaction.
- Interval – Also “continuous,” they are values on a spectrum or continuum, where the distances between values are evenly spaced. Examples: Age, salary, test score (raw), temperature.
Some complexity: For the purposes of statistical analysis, much of what we would consider to be ordinal data is actually thought of differently. I should say, though, that your reviewers will differ here, so it’s good to know what their expectations are. It is so common, though, that I feel comfortable saying that we’ll be dealing with only nominal and interval variables here—from the group of ordinal examples, course grade and BMI classification can be nominal (we have categories of performance or condition), and level of satisfaction, especially if measured using a Likert scale item, would be interval.
Check out your variables. What kind are they? Be careful—some can go either way, depending on how they’re operationalized. You’ll notice that I put raw test score in the interval group. Let’s say, though, that you’re looking at standardized test scores, and students are classified as “Approaches,” “Meets,” or “Exceeds” on the basis of those scores. If you’re more interested in those labels, then you can treat this as a nominal variable.
It can be quite helpful to get some confirmation when it comes to your variables, and when we provide dissertation help, it often starts right here, with assistance in operationalizing variables (figuring out what, say, self-efficacy looks like in concrete terms such that it can be measured) and determining ways to measure them in a particular way. From here, we help with the nastier parts of your dissertation—determining analysis plans and then carrying out your statistical analysis.
Relationships. In providing this consultation, it’s important to focus also on the final criterion—the relationships that might exist among the variables. For our purposes, I’ll divide them into three types, each of which will impact on the testing you decide to take on:
-
Correlation – This kind of relationship is just one of, well, relationship. Here’s an example question: To what extent is there a relationship between fear of clowns and used car buying behavior? What I should say about this might be striking. You’ve heard a lot about independent and dependent variables, but there aren’t any here. Correlation is entirely about relationships—it determines how much two variables are related, but it does not determine what direction that relationship travels. This bring us to…
- Prediction – This is a special kind of relationship in which we can determine whether the values in one variable predict the values in another. We can just modify the previous question: To what extent does fear of clowns predict used car buying behavior? Here, we are indicating clearly that the one stated first (always the independent variable in these questions) predicts the one stated second (always the dependent variable in these questions). Notice that I said “predict.” I did not say “cause” or “impact” or “affect” or “influence” or “determine” or “result in” or any other word or phrase that denotes causation. We can’t know that from anything but experimental designs or the most sophisticated statistical techniques, and these are not the purview of Stats 101.
- Comparison – This is a kind of prediction question, I should say, but it’s more about examining difference. Let’s see an example: What is the difference in used car buying behavior of clown and non-clown individuals? As you can see, the difference is usually between groups of people, some of whom might be clowns, either professionally or for recreation, and non-clowns.

These two factors—each distilled into a nice bulleted list for you—help to determine your eventual inferential statistical analysis, and we’ll see that in just a moment.
Instrumentation Interlude
But first! A quick diversion. You’ll be using instruments to measure these variables, and you best not think you can do this on your own. You shouldn’t, actually, and many programs expressly forbid it. If you’re going to deploy an instrument in your study, you have to make sure that it’s going to measure what you want it to measure and that it is going to do so every time. Creating and validating an instrument in this way can be a dissertation in itself.
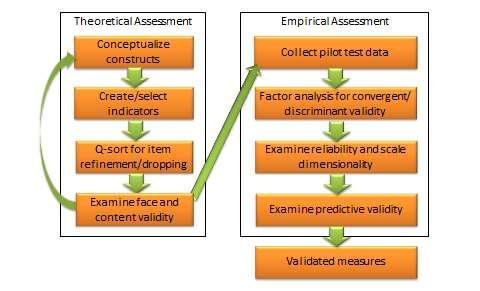
You might be of the sort who feels that the road less traveled is the one you prefer or whatever. In that case, and in situations where you might just have something so specific that no pre-validated instrument yet exists, you kinda have to create your own survey. Pilot testing is a thing in another blog post, but since it bears on statistical analysis, I’ll mention it very briefly here. Requirements vary by university, but they will generally be comprised of a mixture of three things:
- Internal consistency reliability – This measure of reliability determines the extent to which an instrument agrees with itself. If it has two or more sub-scales or domains, then this reliability would be derived for each of the domains/sub-scales and for the overall scale. The test done is a Cronbach’s alpha test, and the goal here is a value at or above .80. It’s not easy to achieve!
- Construct validity – This is a measure of the extent to which the instrument measures what it says that it will, and it often is comprised of two steps: Exploratory Factor Analysis and Confirmatory Factor Analysis. The first step assesses all the questions to determine what “factors” they load onto. You’ll get a grouping, saying for instance that questions 1, 2, 3, 6, 9, 12, 13, and 14 group together, and then that questions 4, 5, 7, 8, 10, 11, and 15 group together—the result is two “factors” (you might have many more factors, and you might have questions that don’t seem to load anywhere, too. From here, the researcher determines what these categories might be and picks the factor loading structure that make the most sense. The second, confirmatory step determines the degree to which those guesses formed in step one are correct.
- Main study testing – This would be the main set of statistical tests you’ll be running in your full study.
It is often that researchers can get away with doing just A and C for a pilot study. However, it can just as easily be that they have to do A and B (which is harder), or even A, B, and C. It not fun.

TESTING!
Okay, so you’re using pre-validated instruments and you’ve figured out both variable types and relationship types and all that jazz. You’re ready for testing. It goes in four phases: (a) descriptive, (b) assumptions, (c) inferential, and (d) post hoc testing. Each is great, and we’ll discuss two of them here:
Descriptive. Okay, so this is the easy part. Most studies cannot be descriptive ones, by the way, simply because it is so easy. Each kind of variable—nominal and interval—is treated differently and through some pretty easy stuff:
- Nominal variables – frequency and percentage (yes, that is it).
- Interval variables – minimum, maximum, mean, median, and standard deviation.
This is a really important step, in spite of how easy it is, simply as it’s needed to summarize your sample and your data set. It’s the “lay of the land” step that sets up everything else.
Inferential. These are the main tests that answer your research questions and test your hypotheses. Again, we’re going to be staying in bivariate land for the most part, and on the shallow end of the statistical pool, we have Chi square, t-test, ANOVA, correlation, and binary logistic regression—don’t let the last one scare you, as it’s gotta be here.
In our previous step above, you checked out your variables and you think you can categorize them (we did this when talking about variable types). How do you know which test or tests to use? As long as you can identify the form of your variables and the way they fit in your research questions and hypotheses, you can determine the test easily:
Table 2. Statistics Menu for Two-variable Calculations, by Variable Type
| Independent Variable | Dependent Variable | Test | Example |
|---|---|---|---|
| Nominal | Nominal | Chi square | Predictive relationship between vocational course completion (IV) and graduation status (DV) |
| Nominal (2 values) | Interval | T-test | Relationship of gender (IV) to ACT Mathematics subscores (DV) |
| Nominal (more than 2 values) | Interval | ANOVA | Relationship of generational cohort status (IV) to digital literacy (DV) |
| Interval | Interval | Correlation | Relationship between global average daily temperature (V1) and number of pirates worldwide (V2) |
| Interval | Nominal | Logistic regression | Predictive relationship between gestational age at birth (IV) on exclusive breastfeeding status (DV) |
A couple of items to point out here: First, this table works for testing where there are two variables. If you have more than two, then things get a little bit more complicated. Second, you’ll notice that there are two nominal-interval options, and the difference between a t-test and one-way ANOVA is in the number of potential values in the independent variable. Gender is a classic example, where most studies use “female” and “male” as the two options. Your study might actually use an intervention, and “pre-intervention” and “post-intervention” might be the two values. In both cases, there are just two options, and so a t-test would be most appropriate. In other cases, it might be that a variable has three or more potential values (e.g., level of education or ethnicity). When this happens, ANOVA is the appropriate test.

Strength and direction and significance, oh my. A final note for us regards some other elements of our table. First, let’s talk about strength and direction. These are different, and some tests tell us only one. You’ll notice that the correlation test, in row 4, uses the following example: Relationship between global average daily temperature (V1) and number of pirates worldwide (V2). Through this test, we can determine that, as global temperature rises, the number of pirates in the world decreases. It’s a strong relationship! However, as we talked about before, we don’t have an independent variable and a dependent variable, and thus we don’t have direction, because we can’t use correlation to determine which variable predicts the other—we just know that they’re related.
To determine direction, we have to use something like regression, and there’s an example there in row 5. We have no choice but to use binary logistic regression when the dependent variable is a nominal variable with two values (also called a dichotomous variable) and the independent variable is interval.
What if you want to determine direction, but you don’t have a variable set-up like that one? Well, if you’re doing something like what appears in example #4, for correlation, you can use a bivariate linear regression analysis—we have a cool example elsewhere on our site about the degree to which team three-point attempts per game predicts team win percentage (spoiler alert: it does).
Regression is also an option when it comes to the t-test and ANOVA options above, and it would be multiple regression that is done in these instances.

If! If your aim was to predict. However, as we talked about, your potential relationship type might be comparison or difference—you might be looking to compare groups of people. If this is so, even though regression sounds cool, you would not use regression. Instead, for your statistical analysis, you would want to remain firmly in the ANOVA family. It is, indeed, a family! There’s ANOVA, ANCOVA, MANOVA, and MANCOVA, and with them, we get firmly into multivariate testing. MANOVA, for instance, works when we have two or more interval dependent variables assessed using the same independent variable. Now we’re getting to the deep end of the statistical pool, and without our floaties on, it’s just not safe.
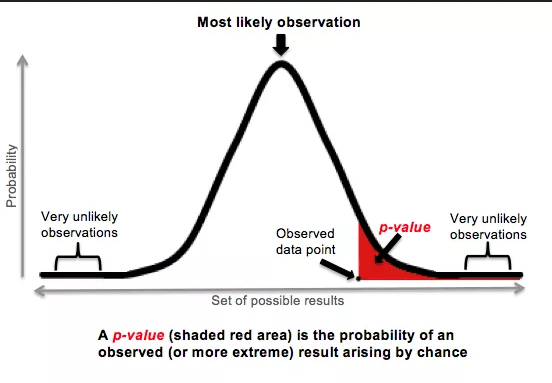
But just one more thing. There is a difference between the strength of a relationship and its statistical significance. Let’s say, for instance, that you use a sample of two coin flips. Just two. Both times, you get tails. Now, in this case, there is a perfect (perfect = could not be stronger) correlation between flipping a coin and getting tails. However, we know from having the ability to think that, well, it was flipped only two times. We could flip the coin three more and get heads each time. That is, the result has everything to do with chance and nothing to do with some mystical connection between coin-flipping and tails-landing. This is how significance works in statistical testing—it’s a measure of the degree to which we can say that the result comes from some actual relationship rather than just chance. This is that alpha that we talked about earlier—in statistical analysis, it becomes your p value. For most studies, if it’s smaller than .05, the you have a result that cannot be attributed to chance!
The End is the Beginning is the End
There is lots more to statistics than just Stats 101. Indeed, this is only class #1. Incidentally, this covers a pretty huge amount of what you’ll need to be successfully. The work of your descriptive statistical analysis and your inferential statistical testing are the main parts, and the latter, in particular, is what determines answers to your research questions and tests of your hypotheses.
It’s a good idea to talk with someone, like a statistician or a statistical consultant, to see exactly how best to move forward—there is a lot to consider here!—and if you do, you won’t at all regret your decision to take on a quantitative study. Even if it was a committee member’s decision for you.